
On-chain data shows the Litecoin Daily Active Addresses indicator has seen a significant increase this year as compared to the last one.
Litecoin Average Active Addresses Have Been Notably Higher This Year
In a new post on X, the market intelligence platform IntoTheBlock has discussed about the year-on-year growth in the Daily Active Addresses for Litecoin. The “Daily Active Addresses” refers to a metric that measures the total number of addresses that are participating in some kind of transaction activity on the network every day.
When the value of this indicator goes up, it means the unique number of addresses making transfers on the blockchain is rising. As the unique number of addresses can be equated with the unique number of users, this kind of trend implies traffic on the chain is increasing.
On the other hand, the metric registering a decline suggests investor interest in the cryptocurrency may be waning as not many users are participating in on-chain activity.
Now, here is a chart that shows the trend in the Litecoin Daily Active Addresses over the past year:
Looks like the value of the metric has been flat in recent months | Source: IntoTheBlock on X
As is visible in the above graph, the Litecoin Daily Active Addresses started 2024 very strongly, but the metric cooled off soon after. There have been some bursts of activity since then, but on the whole, the indicator has shown a consistent sideways trajectory.
On average, there have been around 401,000 addresses interacting on the blockchain every day this year. While this is significantly lower than the massive 1.37 million high from January where LTC surpassed both Bitcoin (BTC) and Ethereum (ETH), it’s still almost 10% higher than the 366,000 average from 2023.
Historically, Litecoin has generally tended to do well in terms of activity-related metrics, due to the fact that the network offers cheap and fast transactions. The traffic growth that LTC has witnessed compared to the previous year would imply users are still being attracted to the chain for its use as a mode of payments.
Recently, the miners have also been investing into the network, as the total LTC hashrate, a measure of the miners’ computing power, has been on the rise. Below is a chart from CoinWarz that displays this trend.
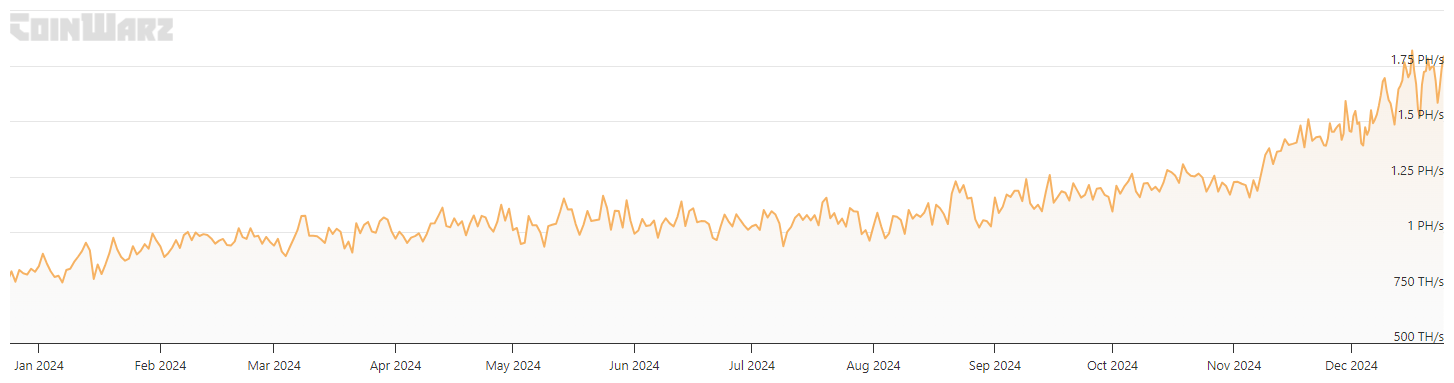
The value of the metric appears to have been growing over the last few weeks | Source: CoinWarz
Growth in the Daily Active Addresses is usually constructive for any cryptocurrency, as it means that there is rising interest in the network, which can potentially help fuel price moves. LTC hasn’t exactly been doing the best in terms of price action lately, but the strong traffic and miner confidence may help it reverse course.
LTC Price
Litecoin had plunged toward the $86 mark at the end of last week, but it appears the coin has seen a jump since then as its price is now trading around $110.

The price of the coin seems to have plunged since its high earlier in the month | Source: LTCUSDT on TradingView
Featured image from Dall-E, CoinWarz.com, IntoTheBlock.com, chart from TradingView.com