Reason to trust
Strict editorial policy that focuses on accuracy, relevance, and impartiality
Created by industry experts and meticulously reviewed
The highest standards in reporting and publishing
Strict editorial policy that focuses on accuracy, relevance, and impartiality
Morbi pretium leo et nisl aliquam mollis. Quisque arcu lorem, ultricies quis pellentesque nec, ullamcorper eu odio.
Bitcoin’s price has continued its downward trend, struggling to regain momentum after reaching its all-time high of $109,000 in January. Over the past week, Bitcoin has declined by 14.6%, with its price dropping an additional 4.4% in the last 24 hours. As of today, Bitcoin is trading at $79,766, pushing it nearly 27% below its ATH.
Amid this price performance, CryptoQuant analyst ibrahimcosar has closely examined Bitcoin’s price movements, focusing on the CME gap phenomenon, which has historically played a role in Bitcoin’s short-term fluctuations.
Related Reading
What To Expect From Bitcoin Based On CME Gap
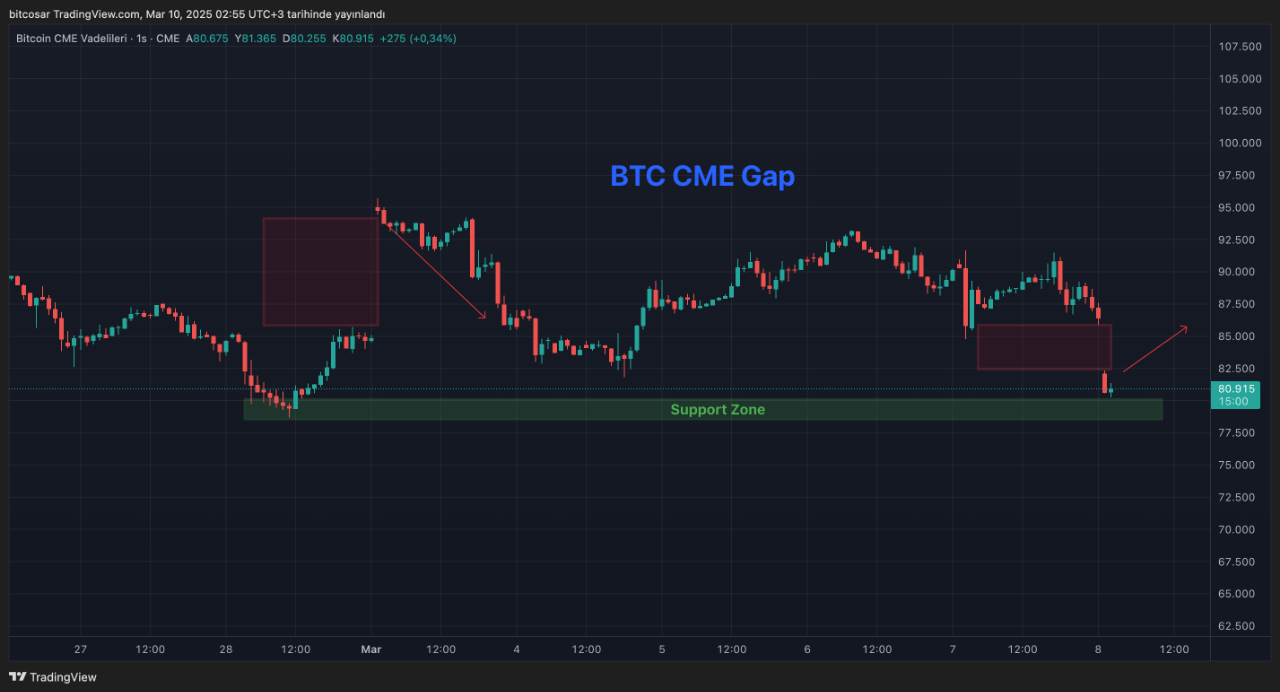
In his latest analysis, Ibrahim highlighted how BTC opened at $82,110 on the CME, creating a gap up to the $86K level. According to him, this price gap could provide clues about Bitcoin’s next move, potentially leading to a short-term attempt at reclaiming $86K–$90K in the coming days.

The CME gap refers to the difference between BTC’s closing price on the Chicago Mercantile Exchange (CME) before the weekend and its opening price after the weekend.
These gaps often get filled as BTC’s price moves back to the levels where the trading pause occurred. Ibrahim notes that Bitcoin previously formed a $10,000 gap on February 28, which was quickly filled within 19 hours.
Now, with BTC currently trading around $79K–$80K, the analyst suggests that another gap has formed above the current price range, indicating that Bitcoin may attempt to fill the $86K–$90K region within the next one to two days.
However, he cautions that this does not necessarily signal a full reversal in BTC’s downtrend. Instead, he maintains that Bitcoin’s broader trend remains uncertain, and its price action through March and early April will be key in determining whether a stronger recovery is on the horizon.
Key Support Levels and Market Sentiment
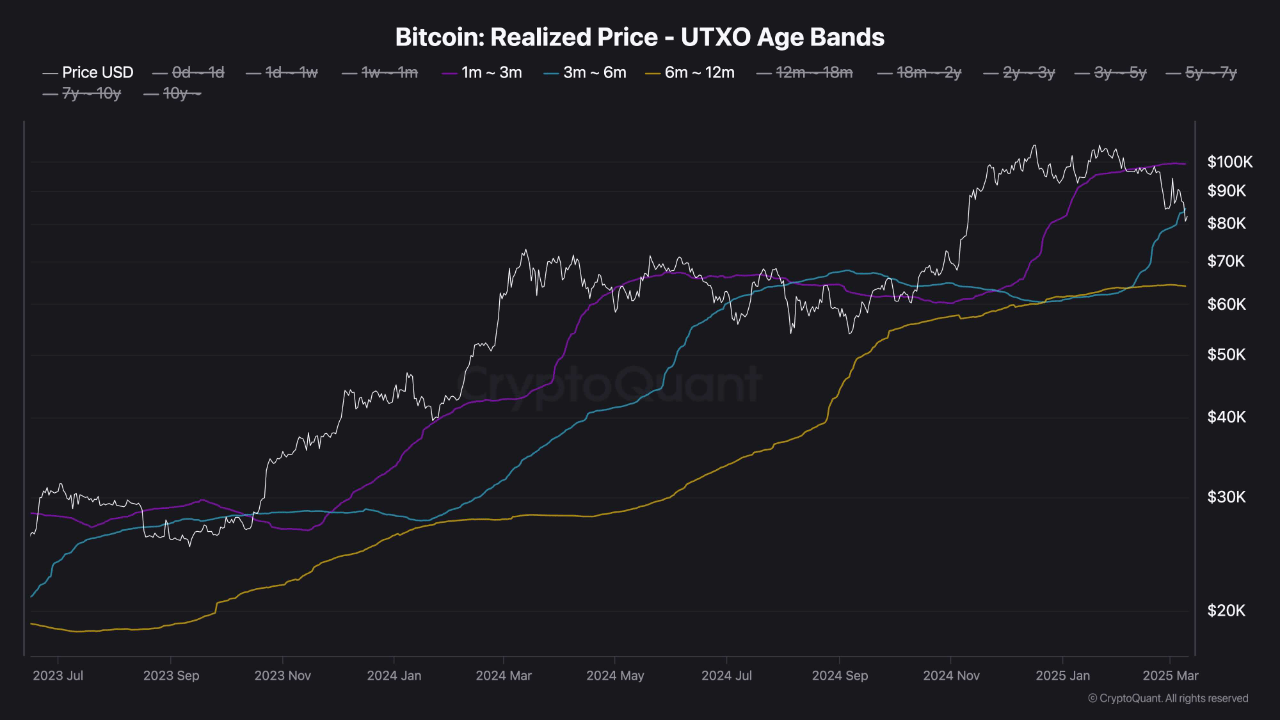
Another market analyst, ShayanBTC, has pointed to $83,000 as a critical support level, based on Bitcoin’s interaction with the Realized Price of 3-6 Month UTXOs.

This metric tracks the average acquisition price of mid-term holders and has historically acted as a significant support or resistance zone. Shayan disclosed that BTC recently tested this level, and holding above it could signal strong investor confidence, potentially reinforcing bullish sentiment.
However, Bitcoin’s decline below $80,000 suggests that this $83,000 support level has already been breached. If Bitcoin fails to regain ground above this threshold, market sentiment could shift towards fear, leading to increased selling pressure from mid-term holders.
In this scenario, BTC could enter a distribution phase, where short to mid-term investors sell their holdings, further driving the price downward. Ibrahim has identified the $78,000–$80,000 region as the next key support zone, which may determine BTC’s near-term trajectory.
Featured image created with DALL-E, Chart from TradingView

