
On-chain data shows the Bitcoin exchange netflow has stayed at negative levels during the past week, implying the whales have been accumulating.
Bitcoin Exchange Netflow Has Remained Below Zero Recently
In a new post on X, the market intelligence platform IntoTheBlock has discussed about the latest trend in the Bitcoin Exchange Netflow. The “Exchange Netflow” here refers to an on-chain indicator that keeps track of the net amount of the asset that’s entering into or exiting out of the wallets associated with centralized exchanges.
When the value of this metric is positive, it means the investors are depositing a net number of tokens to these platforms. As one of the main reasons why holders would transfer their coins to exchanges is for selling-related purposes, this kind of trend can have a bearish effect on the asset.
On the other hand, the indicator being less than zero implies the exchange outflows are outweighing the inflows. The investors generally take their coins away from the custody of these platforms when they want to hold into the long term, so such a trend can prove to be bullish for BTC’s price.
Now, here is the chart shared by the analytics firm that shows the trend in the Bitcoin Exchange Netflow over the past week or so:
The value of the metric seems to have been under the zero mark in recent days | Source: IntoTheBlock on X
As displayed in the above graph, the Bitcoin Exchange Netflow has held a negative value during the last week, which suggests the investors have continuously been withdrawing net amounts from the exchanges.
The net outflows have interestingly continued through the latest plunge in the asset’s price, which could mean that the whale entities are still optimistic about the asset. Naturally, if the trend of accumulation doesn’t break in the coming days, Bitcoin could benefit from a bullish rebound.
In some other news, the latest correction for Bitcoin occurred following a rejection from the top level of the Market Value to Realized Value (MVRV) Extreme Deviation Pricing Bands, as analyst Ali Martinez has explained in an X post.
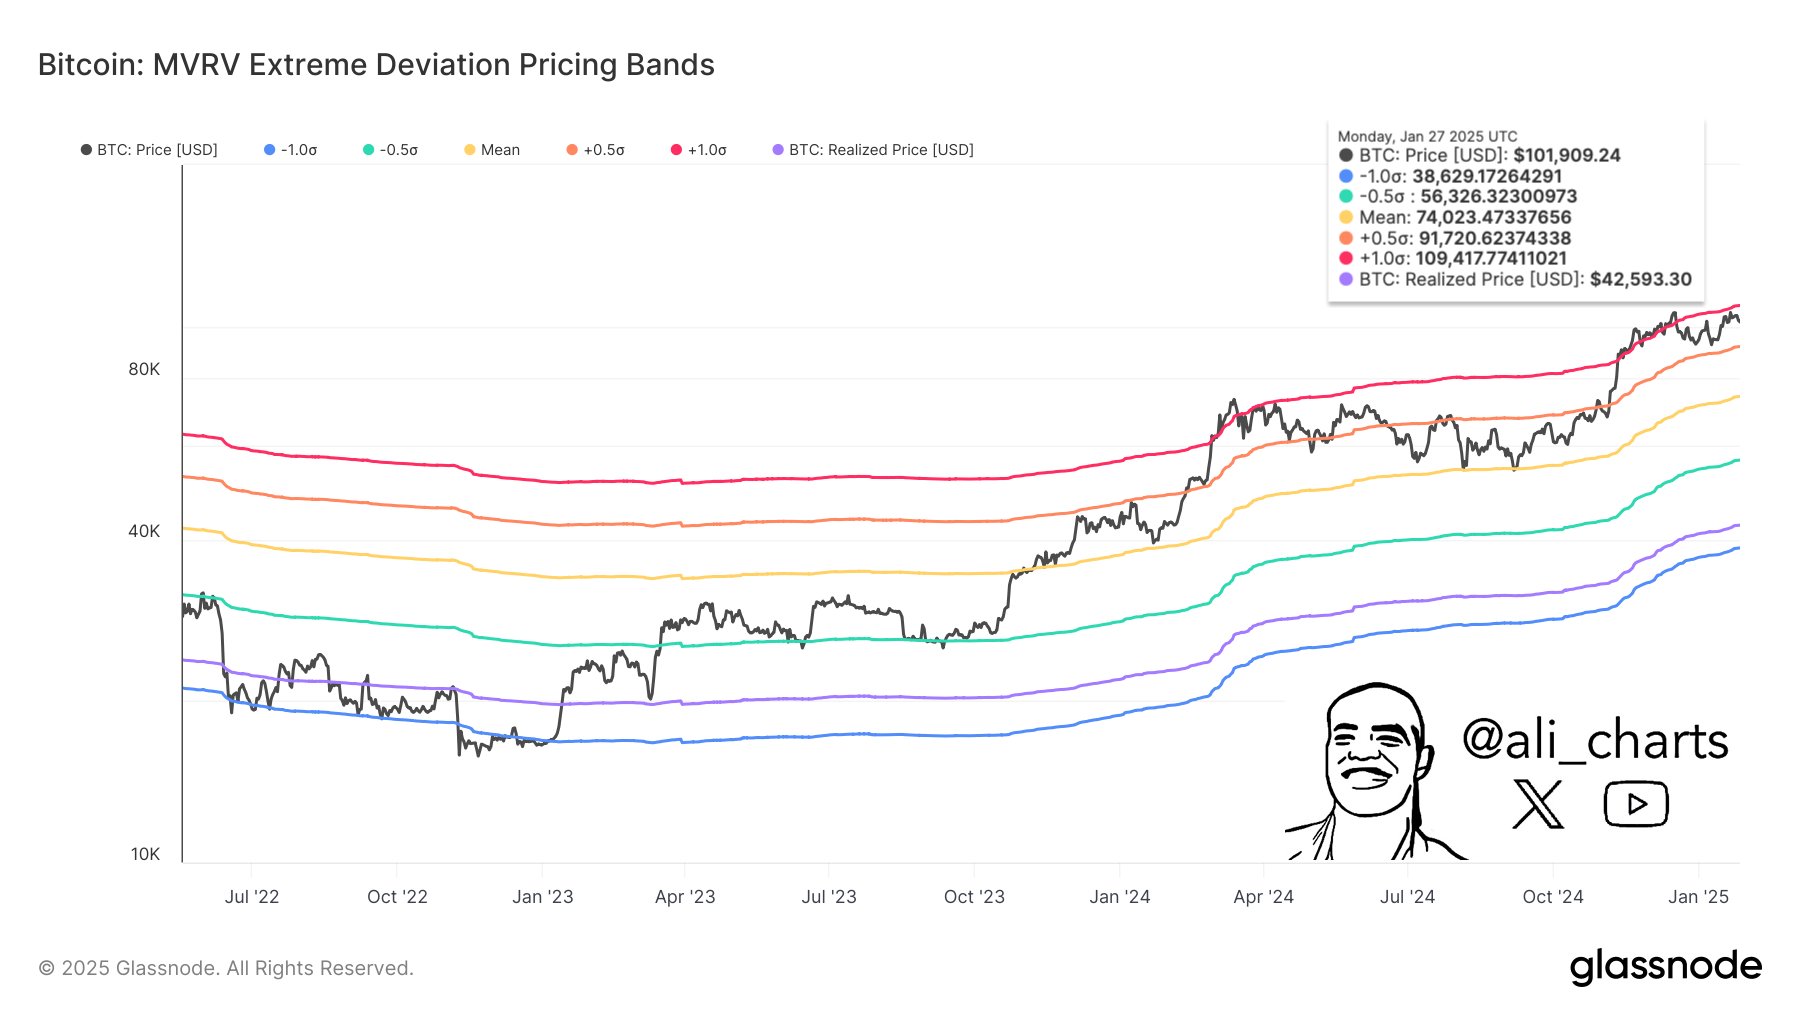
The trend in the various pricing bands of the model over the last few years | Source: @ali_charts on X
This pricing model is based on the popular MVRV Ratio, which basically keeps track of investor profitability. When holder profits get too high, a mass selloff can become probable, which can lead to a top in the asset. The top pricing band of the model serves as a boundary for when this is the most likely to happen.
As Martinez notes,
Bitcoin $BTC was rejected at the upper red pricing band at $109,400. Failing to reclaim this level shifts focus to the next critical support at the orange MVRV pricing band, currently sitting at $91,700.
BTC Price
At the time of writing, Bitcoin is floating around $102,400, down around 2% in the last seven days.

Looks like the price of the coin has plunged over the last couple of days | Source: BTCUSDT on TradingView
Featured image from Dall-E, IntoTheBlock.com, Glassnode.com, chart from TradingView.com