Bitcoin price fluctuations are frequently evaluated using on-chain metrics, technical indicators, and macroeconomic trends. However, one of the most underappreciated yet significant factors in Bitcoin’s price action is Global Liquidity. Many investors may be underutilizing this metric or even misunderstanding how it impacts BTC’s cyclical trends.
Impact on Bitcoin
With increasing discussions on platforms like Twitter (X) and analysts dissecting liquidity charts, understanding the relationship between Global Liquidity and Bitcoin has become crucial for traders and long-term investors alike. However, recent divergences suggest that traditional interpretations might require a more nuanced approach.
Global M2 money supply refers to the total liquid money supply, including cash, checking deposits, and easily convertible near-money assets. Traditionally, when Global M2 expands, capital seeks higher-yielding assets, including Bitcoin, equities, and commodities. Conversely, when M2 contracts, risk assets often decline in value due to tighter liquidity conditions.
Historically, we’ve seen Bitcoin’s price follow the Global M2 expansion, rising when liquidity increases and suffering during contractions. However, in this cycle, we’ve seen a deviation: despite a steady increase in Global M2, Bitcoin’s price action has shown inconsistencies.
Year-on-Year Change
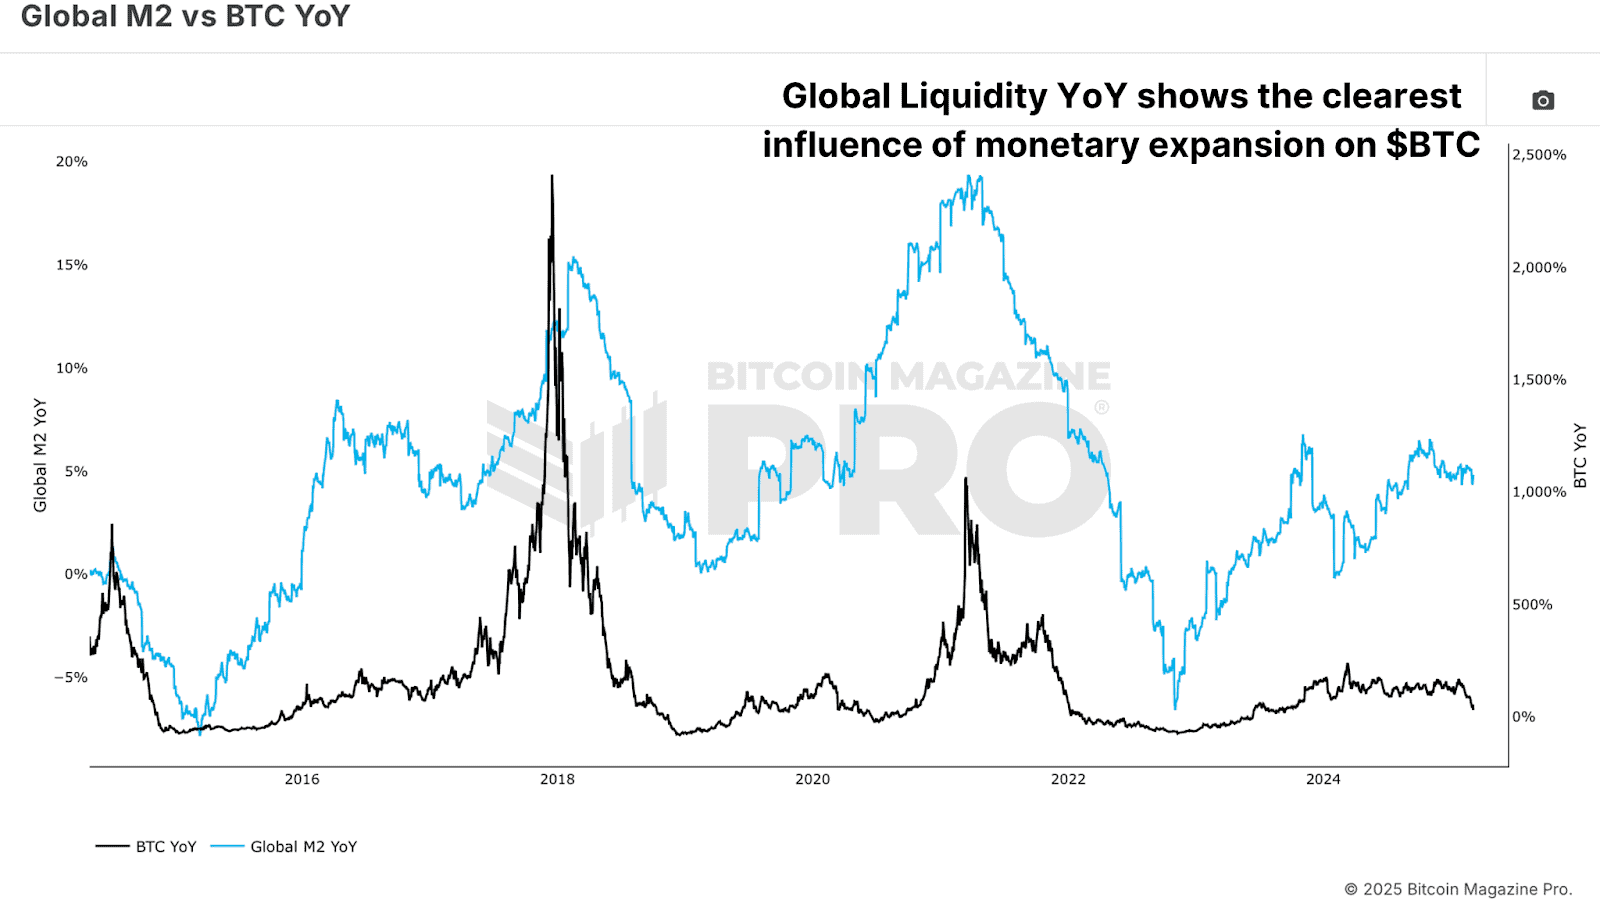
Rather than simply tracking the absolute value of Global M2, a more insightful approach is to analyze its year-on-year rate of change. This method accounts for the velocity of liquidity expansion or contraction, revealing a clearer correlation with Bitcoin’s performance.
When we compare the Bitcoin Year-on-Year Return (YoY) with Global M2 YoY Change, a much stronger relationship emerges. Bitcoin’s strongest bull runs align with periods of rapid liquidity expansion, while contractions precede price declines or prolonged consolidation phases.

For example, during Bitcoin’s consolidation phase in early 2025, Global M2 was steadily increasing, but its rate of change was flat. Only when M2’s expansion accelerates noticeably can Bitcoin break out towards new highs.
Liquidity Lag
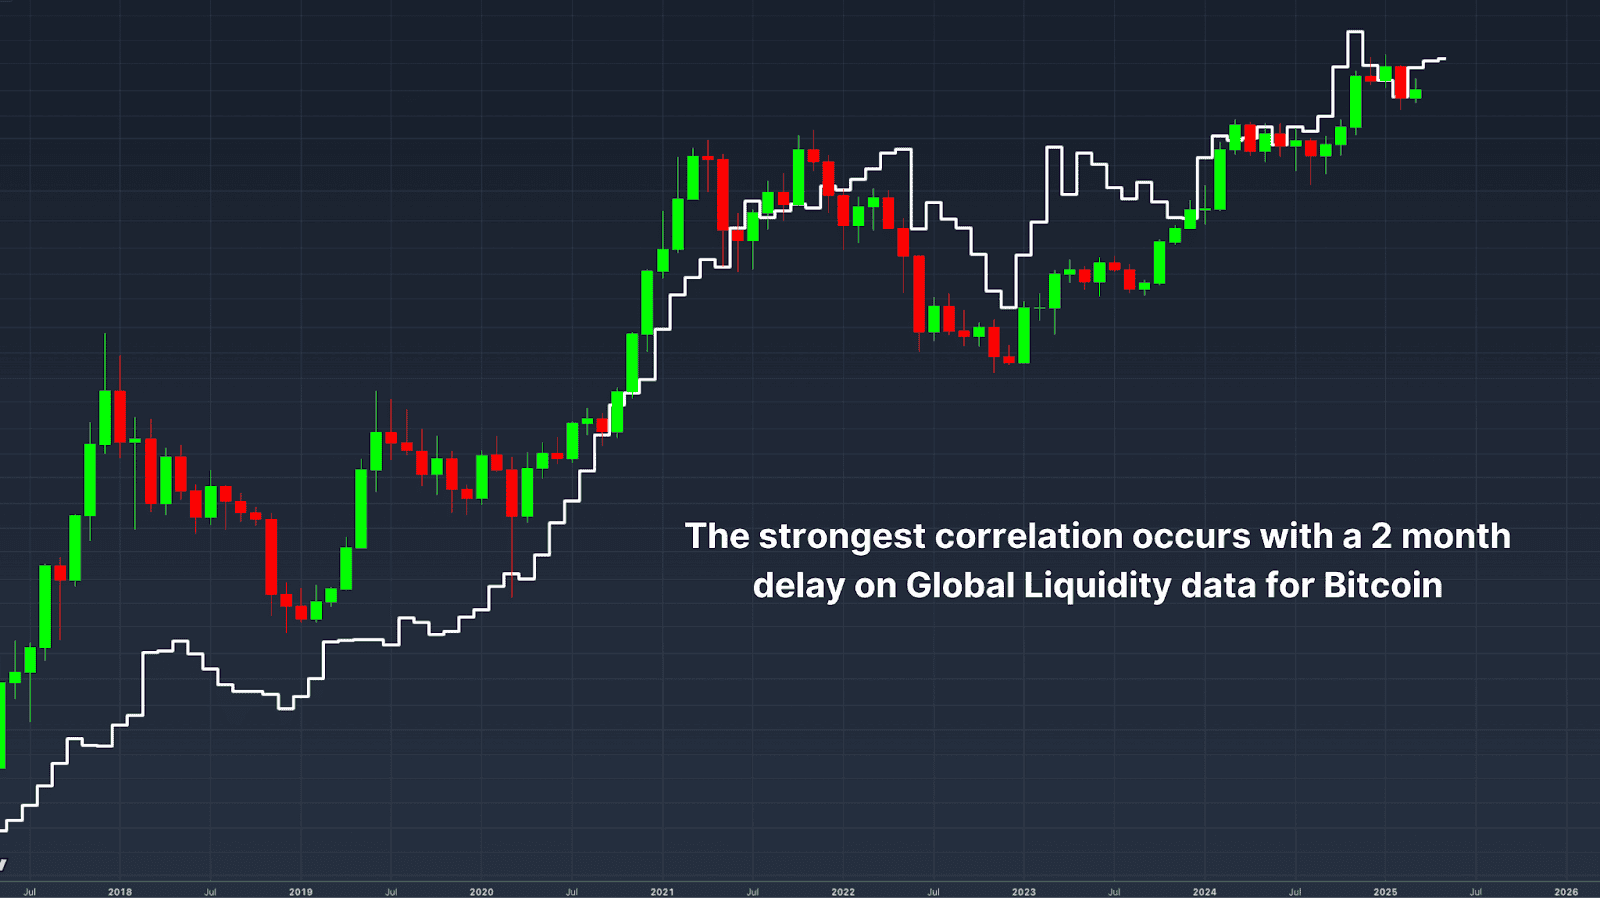
Another key observation is that Global Liquidity does not impact Bitcoin instantly. Research suggests that Bitcoin lags behind Global Liquidity changes by approximately 10 weeks. By shifting the Global Liquidity indicator forward by 10 weeks, the correlation with Bitcoin strengthens significantly. However, further optimization suggests that the most accurate lag is around 56 to 60 days, or approximately two months.

Bitcoin Outlook
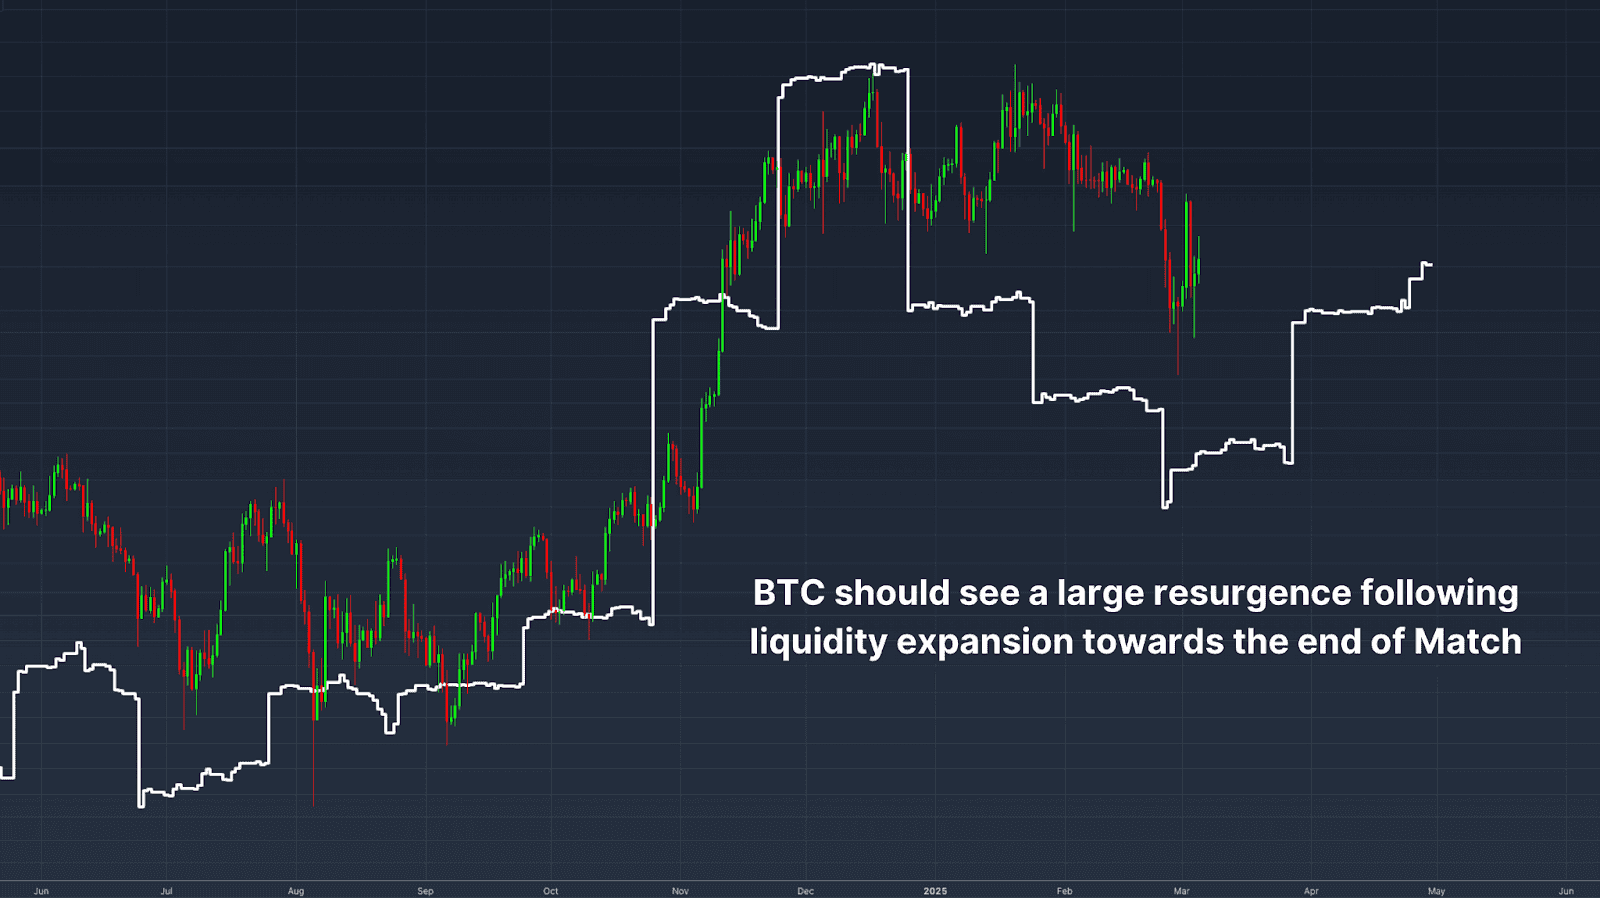
Throughout most of 2025, Global Liquidity has been in a flattening phase following a significant expansion in late 2024 that propelled Bitcoin to new highs. This flattening coincided with Bitcoin’s consolidation and retracement to around $80,000. However, if historical trends hold, a recent resurgence in liquidity growth should translate into another leg up for BTC by late March.

Conclusion
Monitoring Global Liquidity is an essential macro indicator for anticipating Bitcoin’s trajectory. However, rather than relying on static M2 data, focusing on its rate of change and understanding the two-month lag effect offers a much more precise predictive framework.
As Global economic conditions evolve and central banks adjust their monetary policies, Bitcoin’s price action will continue to be influenced by liquidity trends. The coming weeks will be pivotal; Bitcoin could be poised for a major move if Global Liquidity continues its renewed acceleration.
Enjoyed this? Explore more on Bitcoin price shifts and market cycles in our recent guide to mastering Bitcoin on-chain data.
Explore live data, charts, indicators, and in-depth research to stay ahead of Bitcoin’s price action at Bitcoin Magazine Pro.
Disclaimer: This article is for informational purposes only and should not be considered financial advice. Always do your own research before making any investment decisions.

