
Dogecoin has often demonstrated its ability to defy expectations and go on notable price surges from time to time. The most notable of these rallies was the 2021 rally, which saw Dogecoin peaking at its current all-time high. However, the best might be yet to come, as technical analysis suggests that Dogecoin is still on track to repeat this move and possibly even surpass it.
Particularly, recent Dogecoin fractal analysis suggests that Dogecoin is on track to reach anywhere between $4 and $23 within the foreseable future.
Dogecoin’s Price Decline And Historical Fractal Patterns
Dogecoin’s price action has slowed considerably in the past four weeks. The last two weeks of these four weeks have been highlighted by a notable decline, which has culminated in the Dogecoin price breaking below the multimonth resistance level of $0.35 it breached in early November.
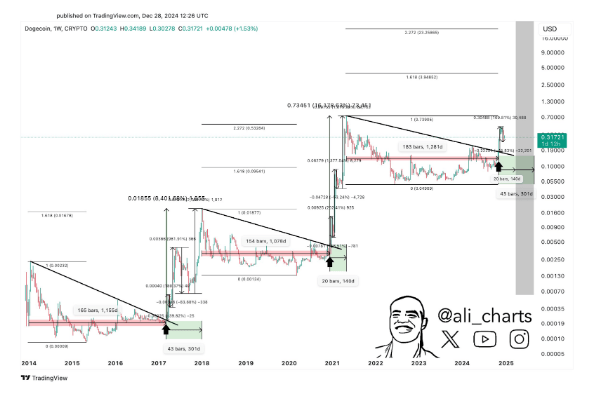
According to technical analysis by crypto analyst Ali Martinez, Dogecoin is currently playing out a fractal movement on the weekly candlestick timeframe chart. Fractals, in technical analysis, refer to recurring patterns that manifest across different scales and timeframes. For Dogecoin, this fractal movement stretches back to its earliest days as a meme coin in 2013 and provides a historical lens to predict its current trajectory.
As shown by the price chart below, the fractal movement is highlighted by a notable correction after a break above a downward sloping trendline drawn from the previous cycle’s high. In the case of this cycle, the correction has seen Dogecoin falling as low as 45.8% from the recent peak around $0.48. However, the corrections in the past two cycles, as shown by the chart below, ended up rebounding to create strong multi-month rallies to new all-time highs.
In the first breakout cycle of 2017, Dogecoin followed a similar trajectory. After an initial breakout and correction, the cryptocurrency embarked on a parabolic rally, ultimately peaking at $0.01855 in early 2018.
This peak aligned closely with the 1.618 Fibonacci extension level measured from the low of the preceding bear market. The second breakout cycle occurred in 2021 and led to an even more dramatic price surge. Dogecoin reached an all-time high of $0.7316, surpassing the 2.72 Fibonacci extension level from the low of the previous bear market.
Fractal Points To Another Parabolic Rally For Dogecoin
Based on the outcomes of previous price action, the current fractal pattern suggests that Dogecoin may be preparing for a similar rebound in the coming months. The extent of this rebound also hinges on the extent of the current correction. If the fractal breakout were to repeat itself, the Dogecoin price could go on another parabolic rally to the 1.618 or 2.272 Fib extension levels, or somewhere in between.
According to Martinez, this would put the price targets anywhere between $4 at the 1.618 Fibonacci extension and $23 at the 2.272 Fibonacci extension.
As of now, Dogecoin is trading at $0.326. A rally to $4 would represent a 1,126% increase from its current price, while a climb to $23 would represent a 6,955% increase.
Featured image from CNET, chart from TradingView