
Official Trump [TRUMP] attracted renewed market attention after posting a 15.79% daily gain that lifted the token to $1.98.
Trading activity strengthened alongside the advance, with 24-hour volume rising 24.45% to approximately $256 million.
The combination of rising prices and expanding volume suggested that market participants had returned after an extended period of weakness.
Interest surrounding the token increased as the rally developed, while the broader recovery attempt stood out after months of declining price action.
Why does seller dominance persist beneath the rally?
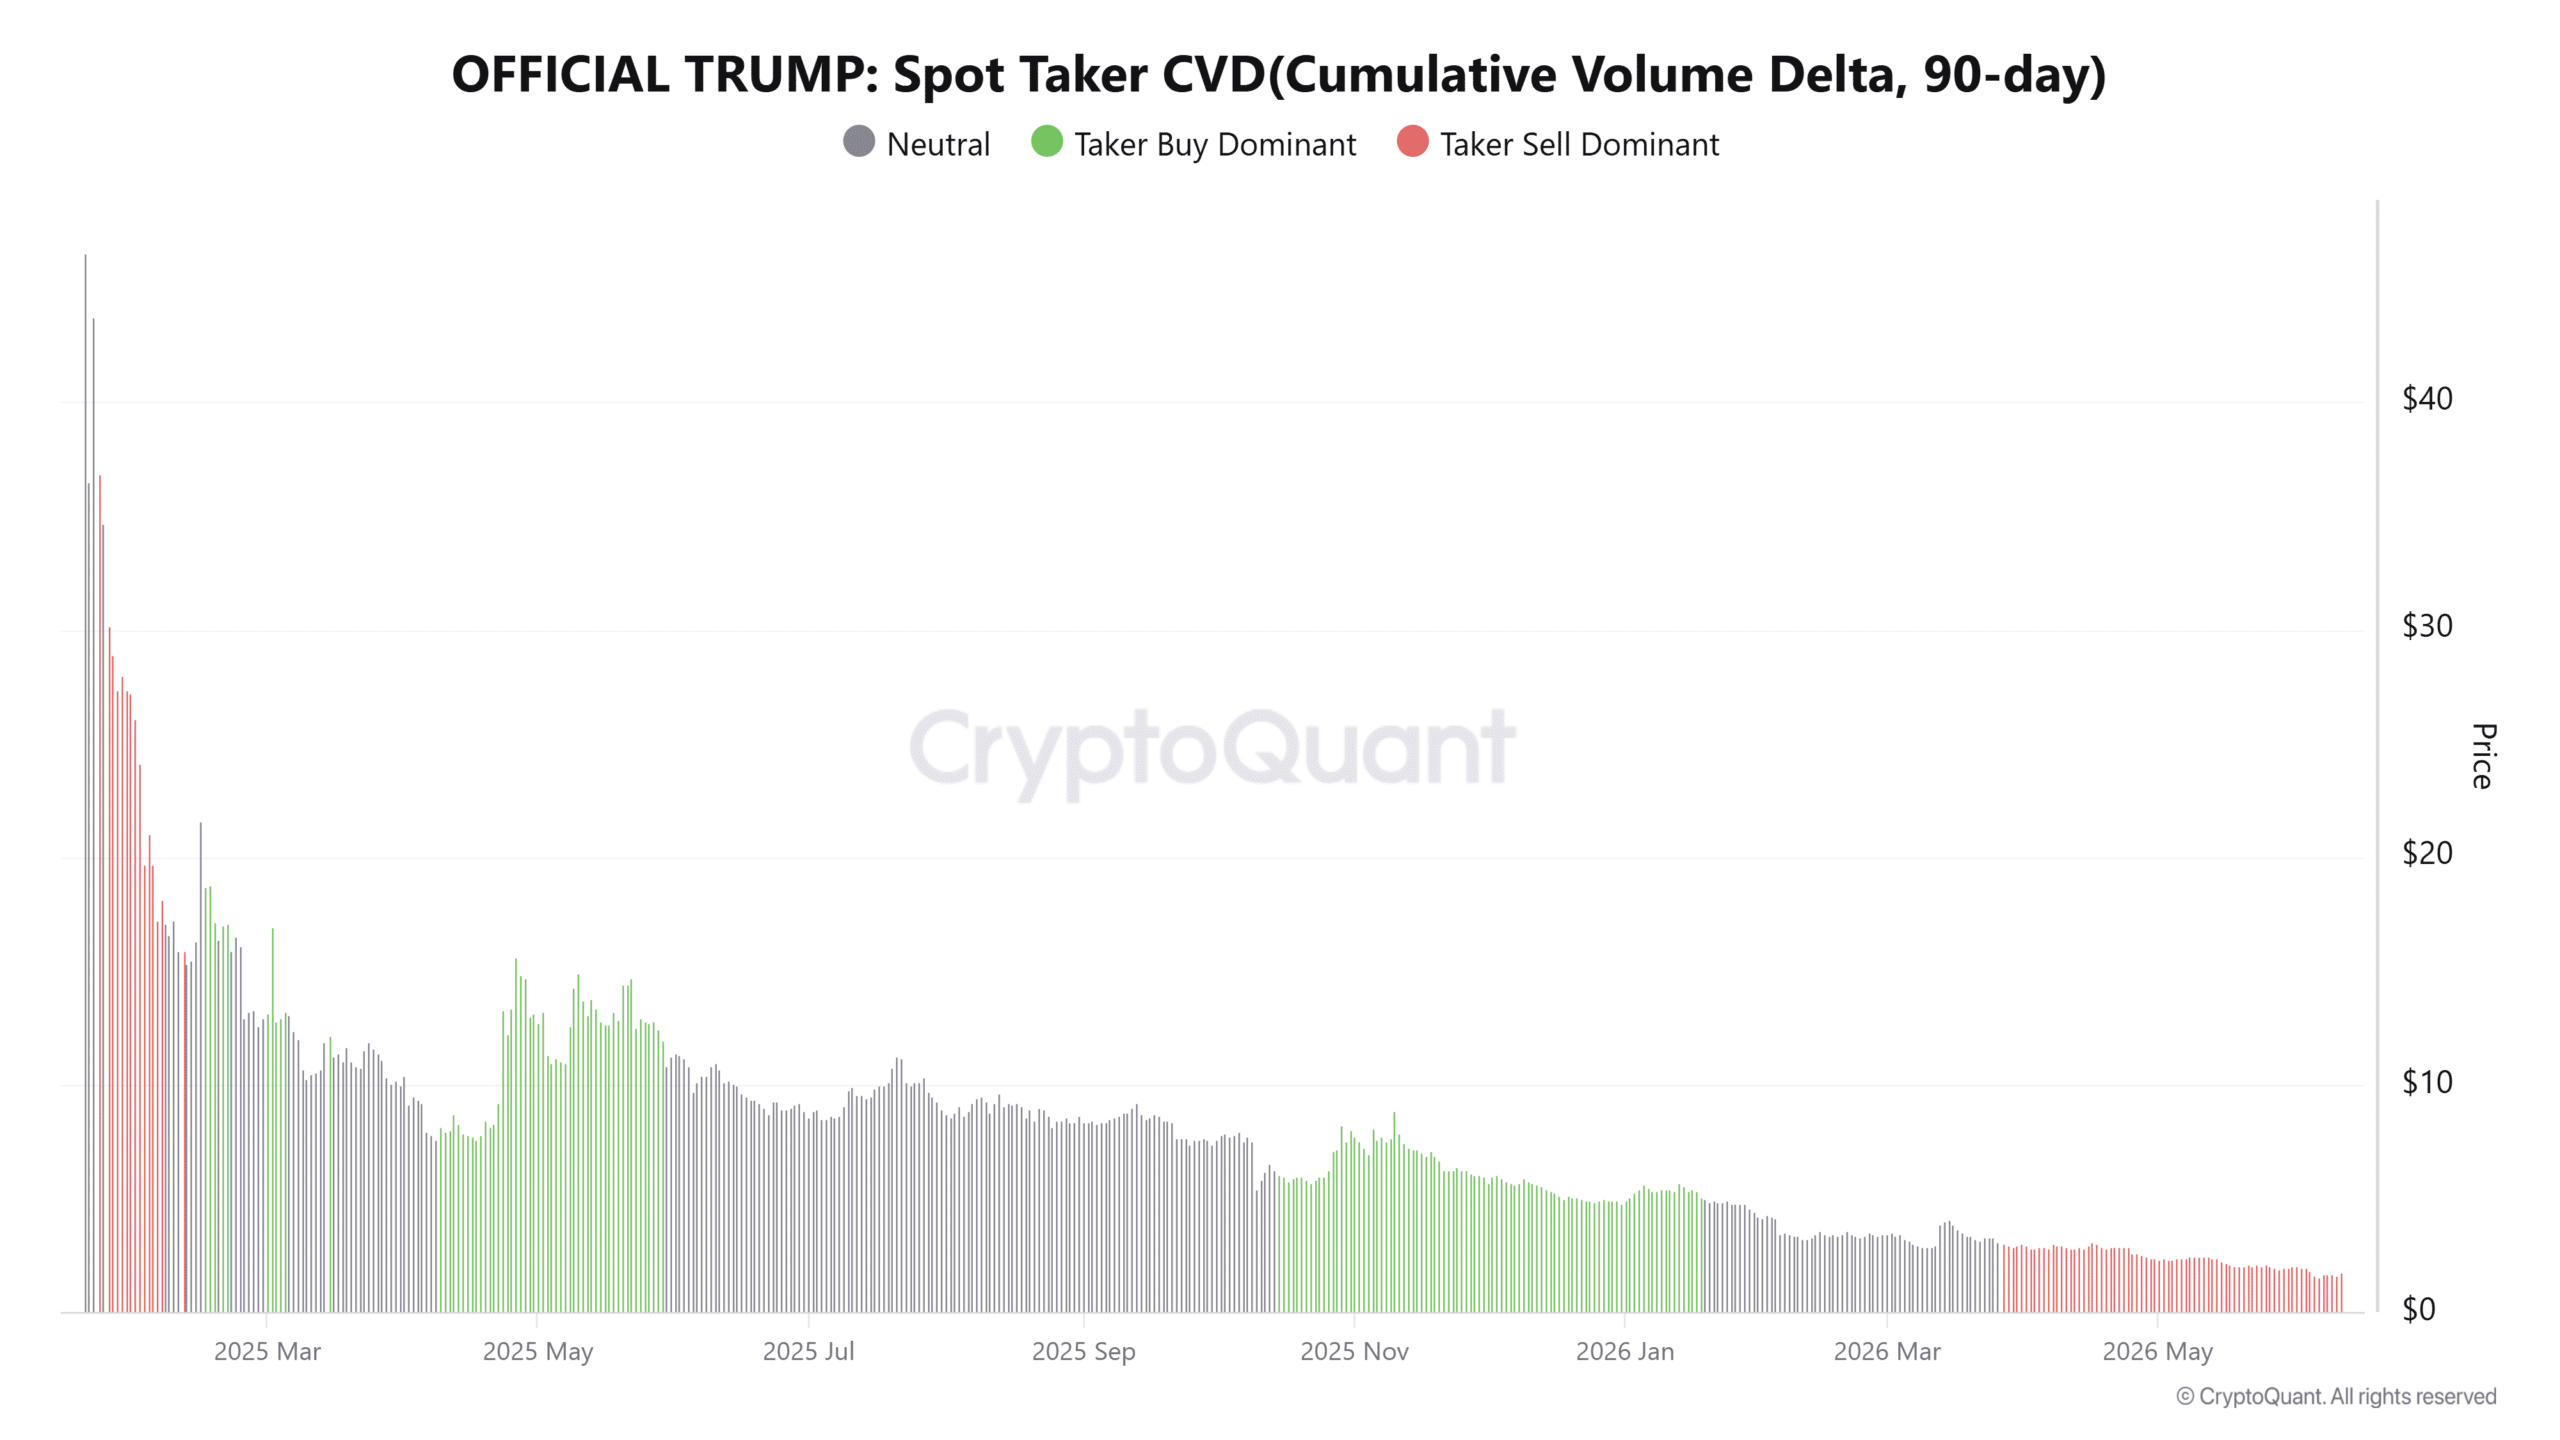
Despite the strong upward move, Spot Taker CVD continued signaling seller dominance. So, aggressive sell orders still outweighed aggressive buy orders over the measured period.
The divergence created an interesting market structure because price advanced while underlying order flow remained tilted toward sellers. Such behavior often reflects traders taking profits into strength rather than fully embracing a bullish continuation.
However, buyers absorbed much of that selling pressure and prevented a meaningful pullback from developing during the rally. The persistence of seller-dominant order flow suggested that market conviction remained mixed beneath the surface.
TRUMP breaks from channel pressure
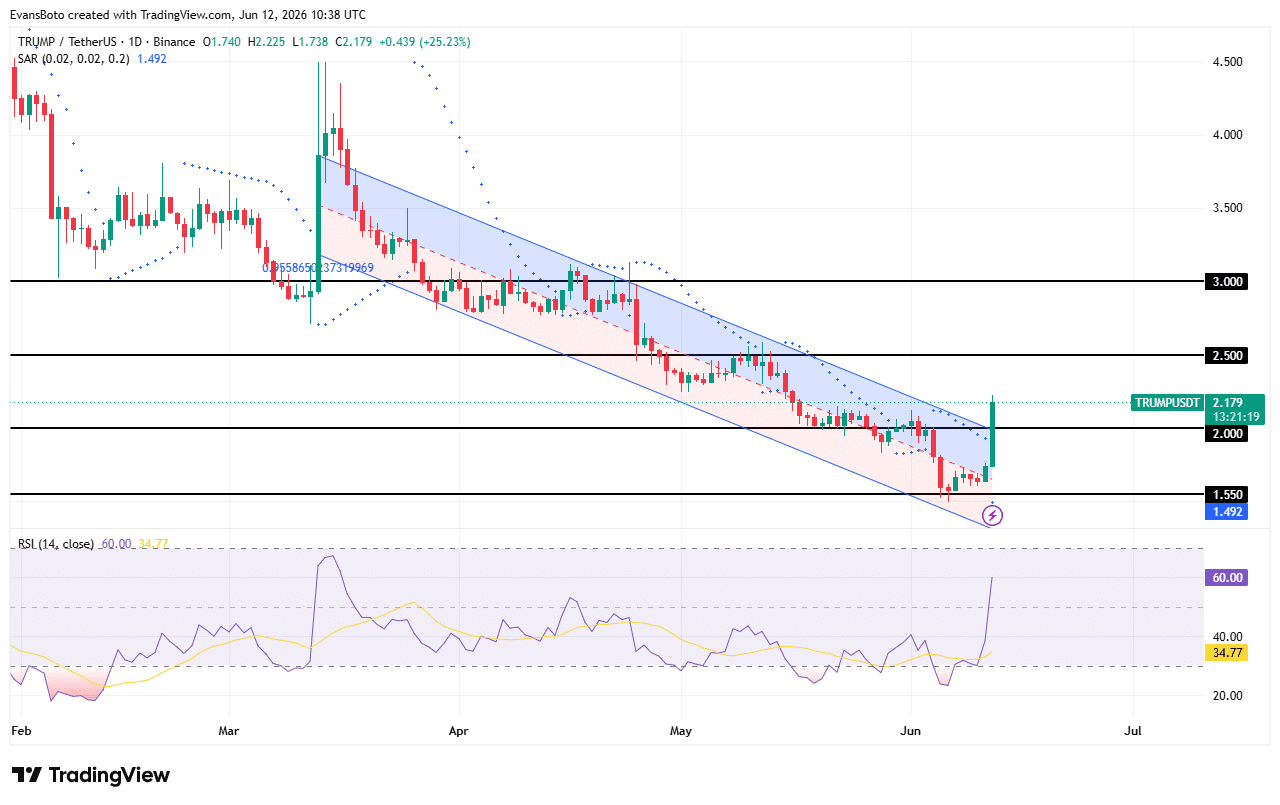
After rebounding from the lower boundary of its multi-month descending channel, TRUMP accelerated sharply and broke above the channel’s upper resistance near $2.00, signaling a potential trend reversal.
The rally pushed the token to around $2.18, marking a gain of more than 25% on the day and confirming strong buyer participation following weeks of sustained weakness.
RSI climbed to 60, its highest reading in several weeks, indicating strengthening bullish conditions without yet entering overbought territory. Parabolic SAR remained below price at $1.49, reinforcing the newly established upward trend.
The breakout has shifted attention toward the next resistance zone around $2.50, which previously acted as a major support level before the broader decline.
If buyers maintain control and defend the $2.00 breakout level, TRUMP could extend its recovery toward $2.50 and potentially challenge $3.00 thereafter.
However, failure to hold above $2.00 would likely invite profit-taking and trigger a retest of support near $1.75. Based on the current structure, the bullish scenario remains favored.
Are liquidation clusters pulling TRUMP higher?
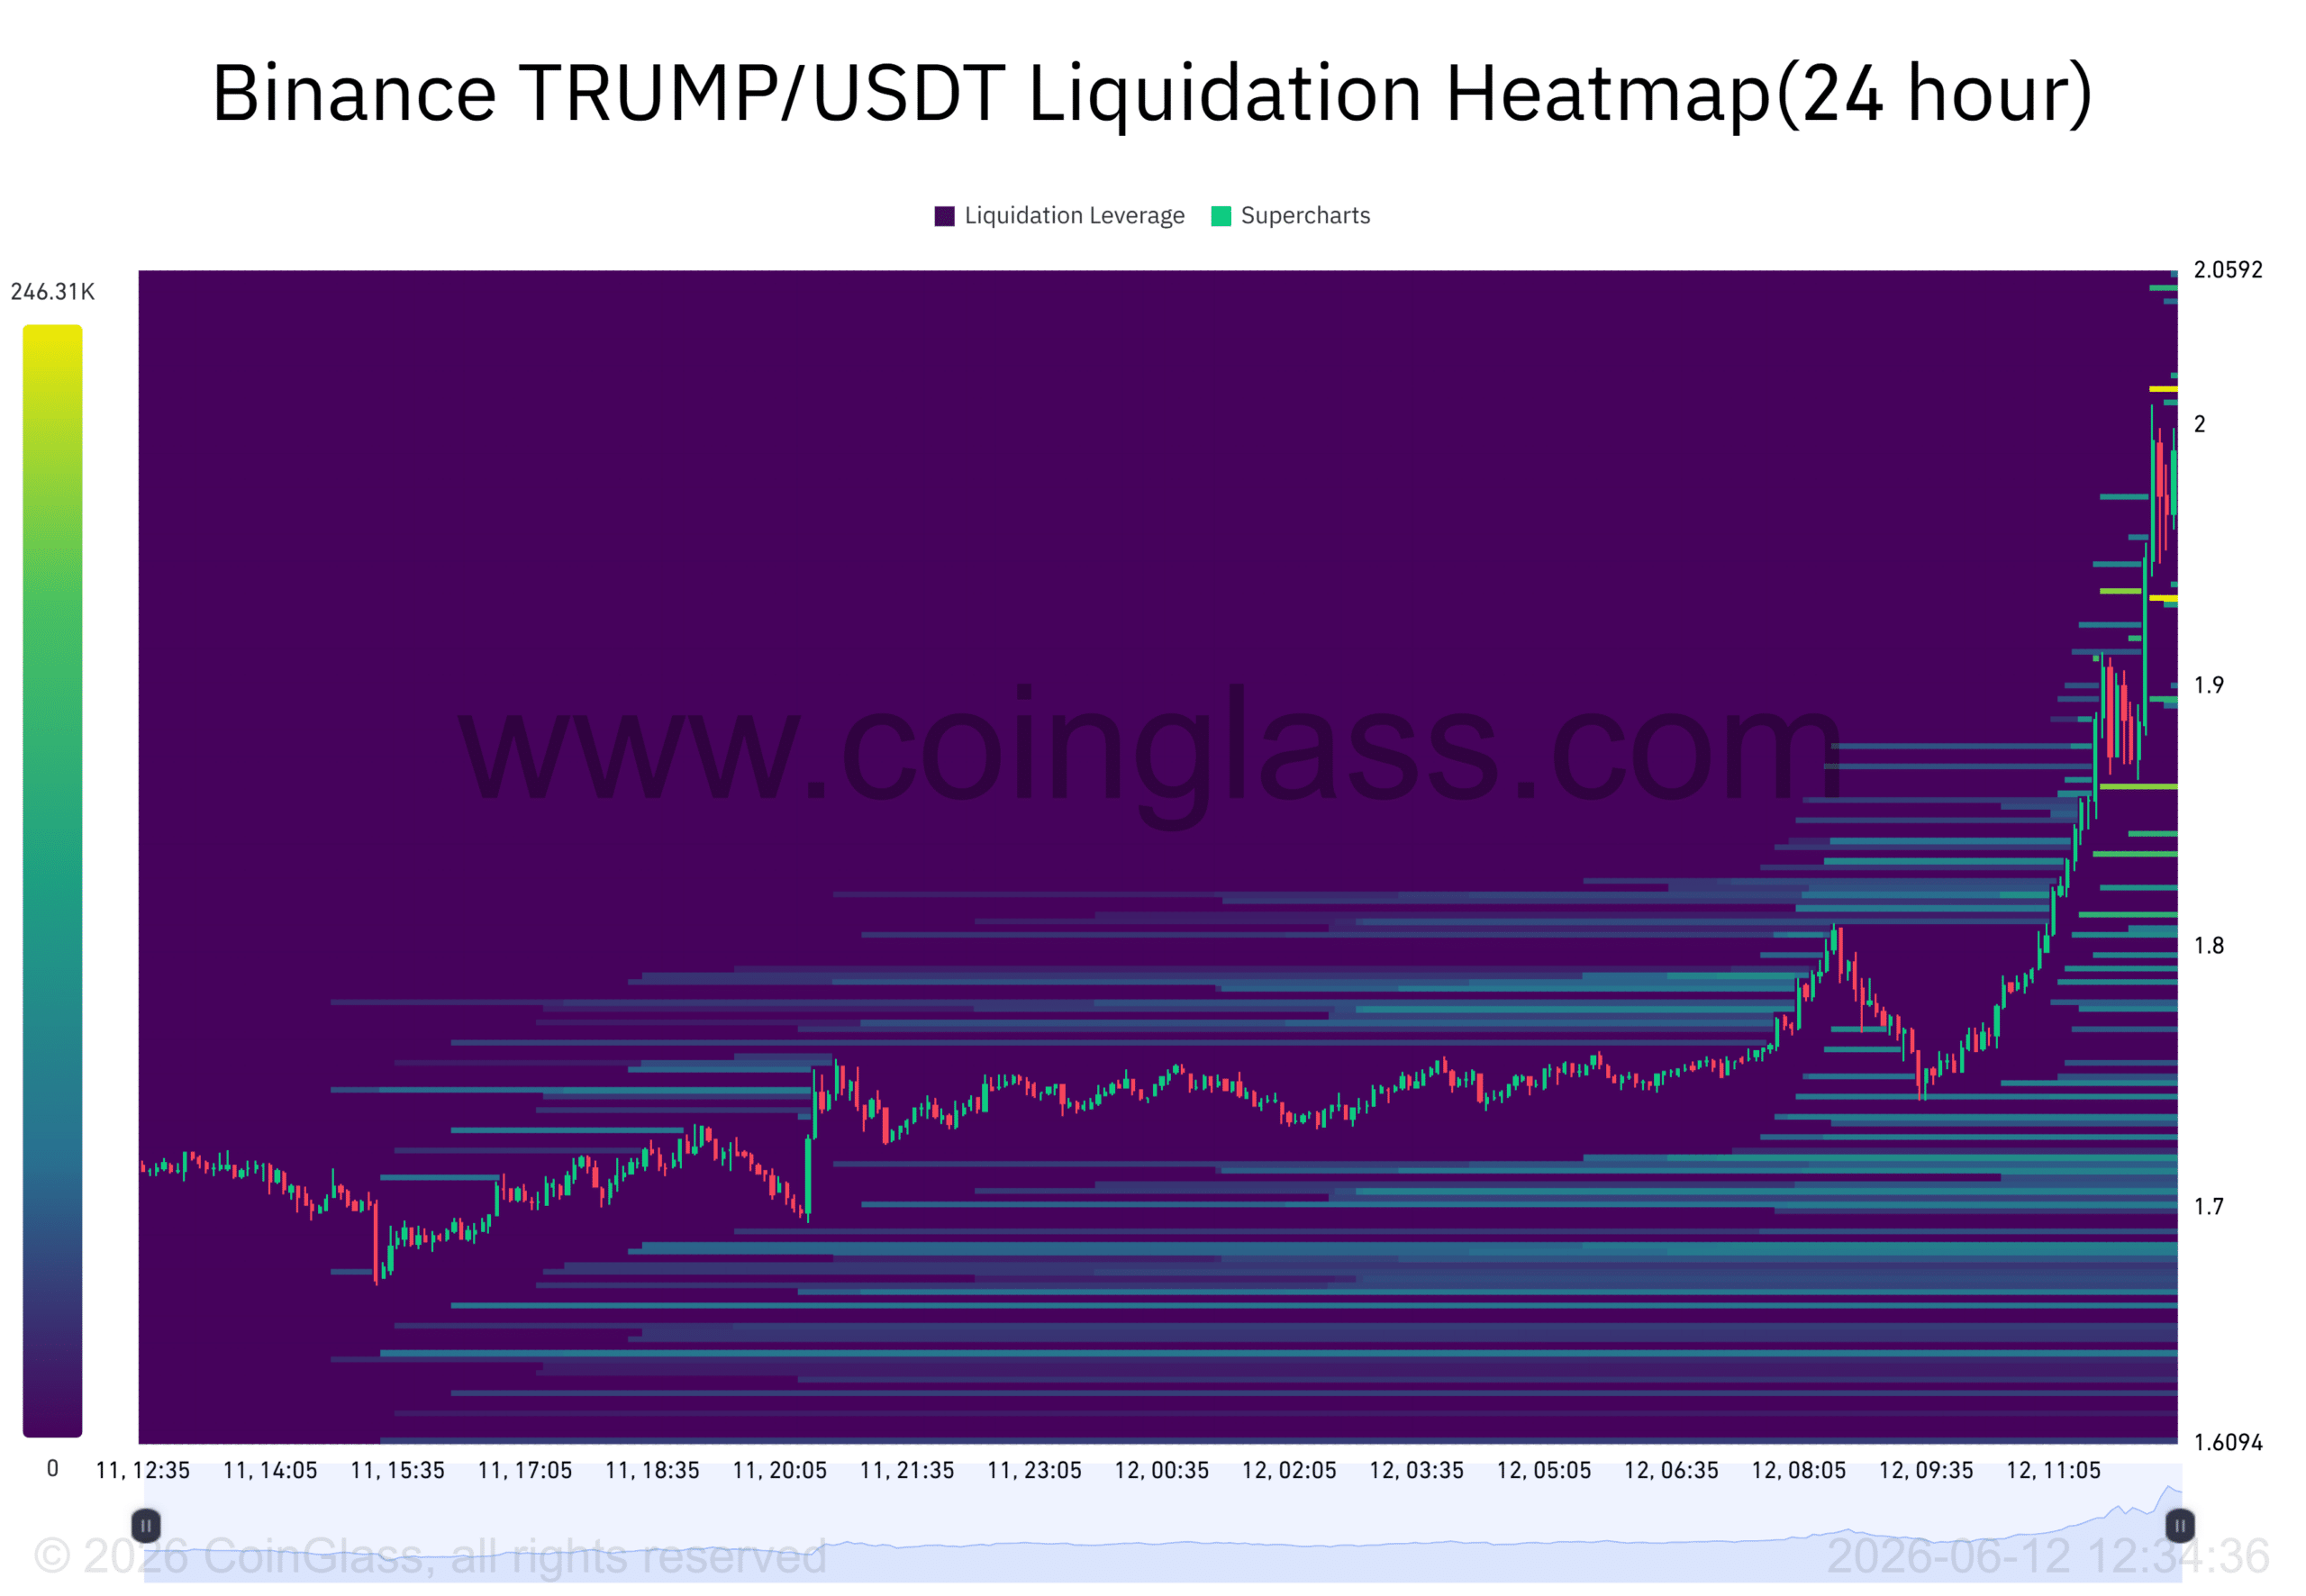
Liquidation data highlighted a concentration of leverage above the current market price, particularly around and beyond the $2.00 region.
The Binance TRUMP/USDT liquidation heatmap showed several dense clusters extending toward roughly $2.05, where leveraged short positions appeared vulnerable.
Price approached these areas rapidly during the latest rally, increasing the possibility of additional short liquidations if buyers maintained control.
Traders often view such clusters as liquidity magnets because price frequently gravitates toward heavily leveraged zones.
If the token continued attracting demand, those liquidation pockets could become the next target area. A successful sweep of nearby leverage would likely strengthen bullish sentiment and encourage traders to pursue higher resistance levels.
Final Summary
- TRUMP reclaimed key technical levels as volume growth reinforced buyer participation.
- Overhead liquidation clusters may attract price if current recovery strength persists.