
On-chain data shows activity on the XRP network has registered a large spike over the past week as volatility has engulfed the market.
XRP Active Addresses & Volume Have Shot Up Recently
In a new post on X, analyst Ali Martinez has discussed about the latest trend in the Active Addresses of XRP. The “Active Addresses” here refers to an on-chain indicator that keeps track of the total number of addresses that are becoming ‘active’ or online on the network every day.
An address is said to be active when it participates in some kind of transfer activity. This applies regardless of whether the address is involved as a sender or receiver. Thus, a single transaction always leads to the activation of at least two wallets.
When the value of the Active Addresses rises, it means there are more addresses making transfers on the network. Such a trend suggests trading interest in the asset is going up among the investors.
On the other hand, the indicator going down implies the holders may be paying lesser attention to the cryptocurrency, as fewer of them are becoming involved in transactions.
Now, here is the Glassnode chart shared by the analyst that shows the trend in the XRP Active Addresses over the past few weeks:
The value of the metric appears to have witnessed a spike in recent days | Source: @ali_charts on X
As displayed in the above graph, the XRP Active Addresses ended February at a low, but since this month of March has begun, the indicator has seen a strong revival.
“The number of active XRP addresses has skyrocketed by 620% in the past week, climbing from 74,589 to 462,650!” notes Martinez. The sharp jump in the indicator has come as the coin has been going through some high volatility.
Generally, investors get attracted to the market during periods like this and make some panic moves. In turn, the high activity ends up adding to the price volatility.
Considering that the Active Addresses is still at a high level right now, it’s possible that the cryptocurrency’s sharp price action may not have ended just yet. Another indicator that correlates to the network activity is the Transfer Volume and as the analyst has pointed out in another X post, this metric has also spiked recently.
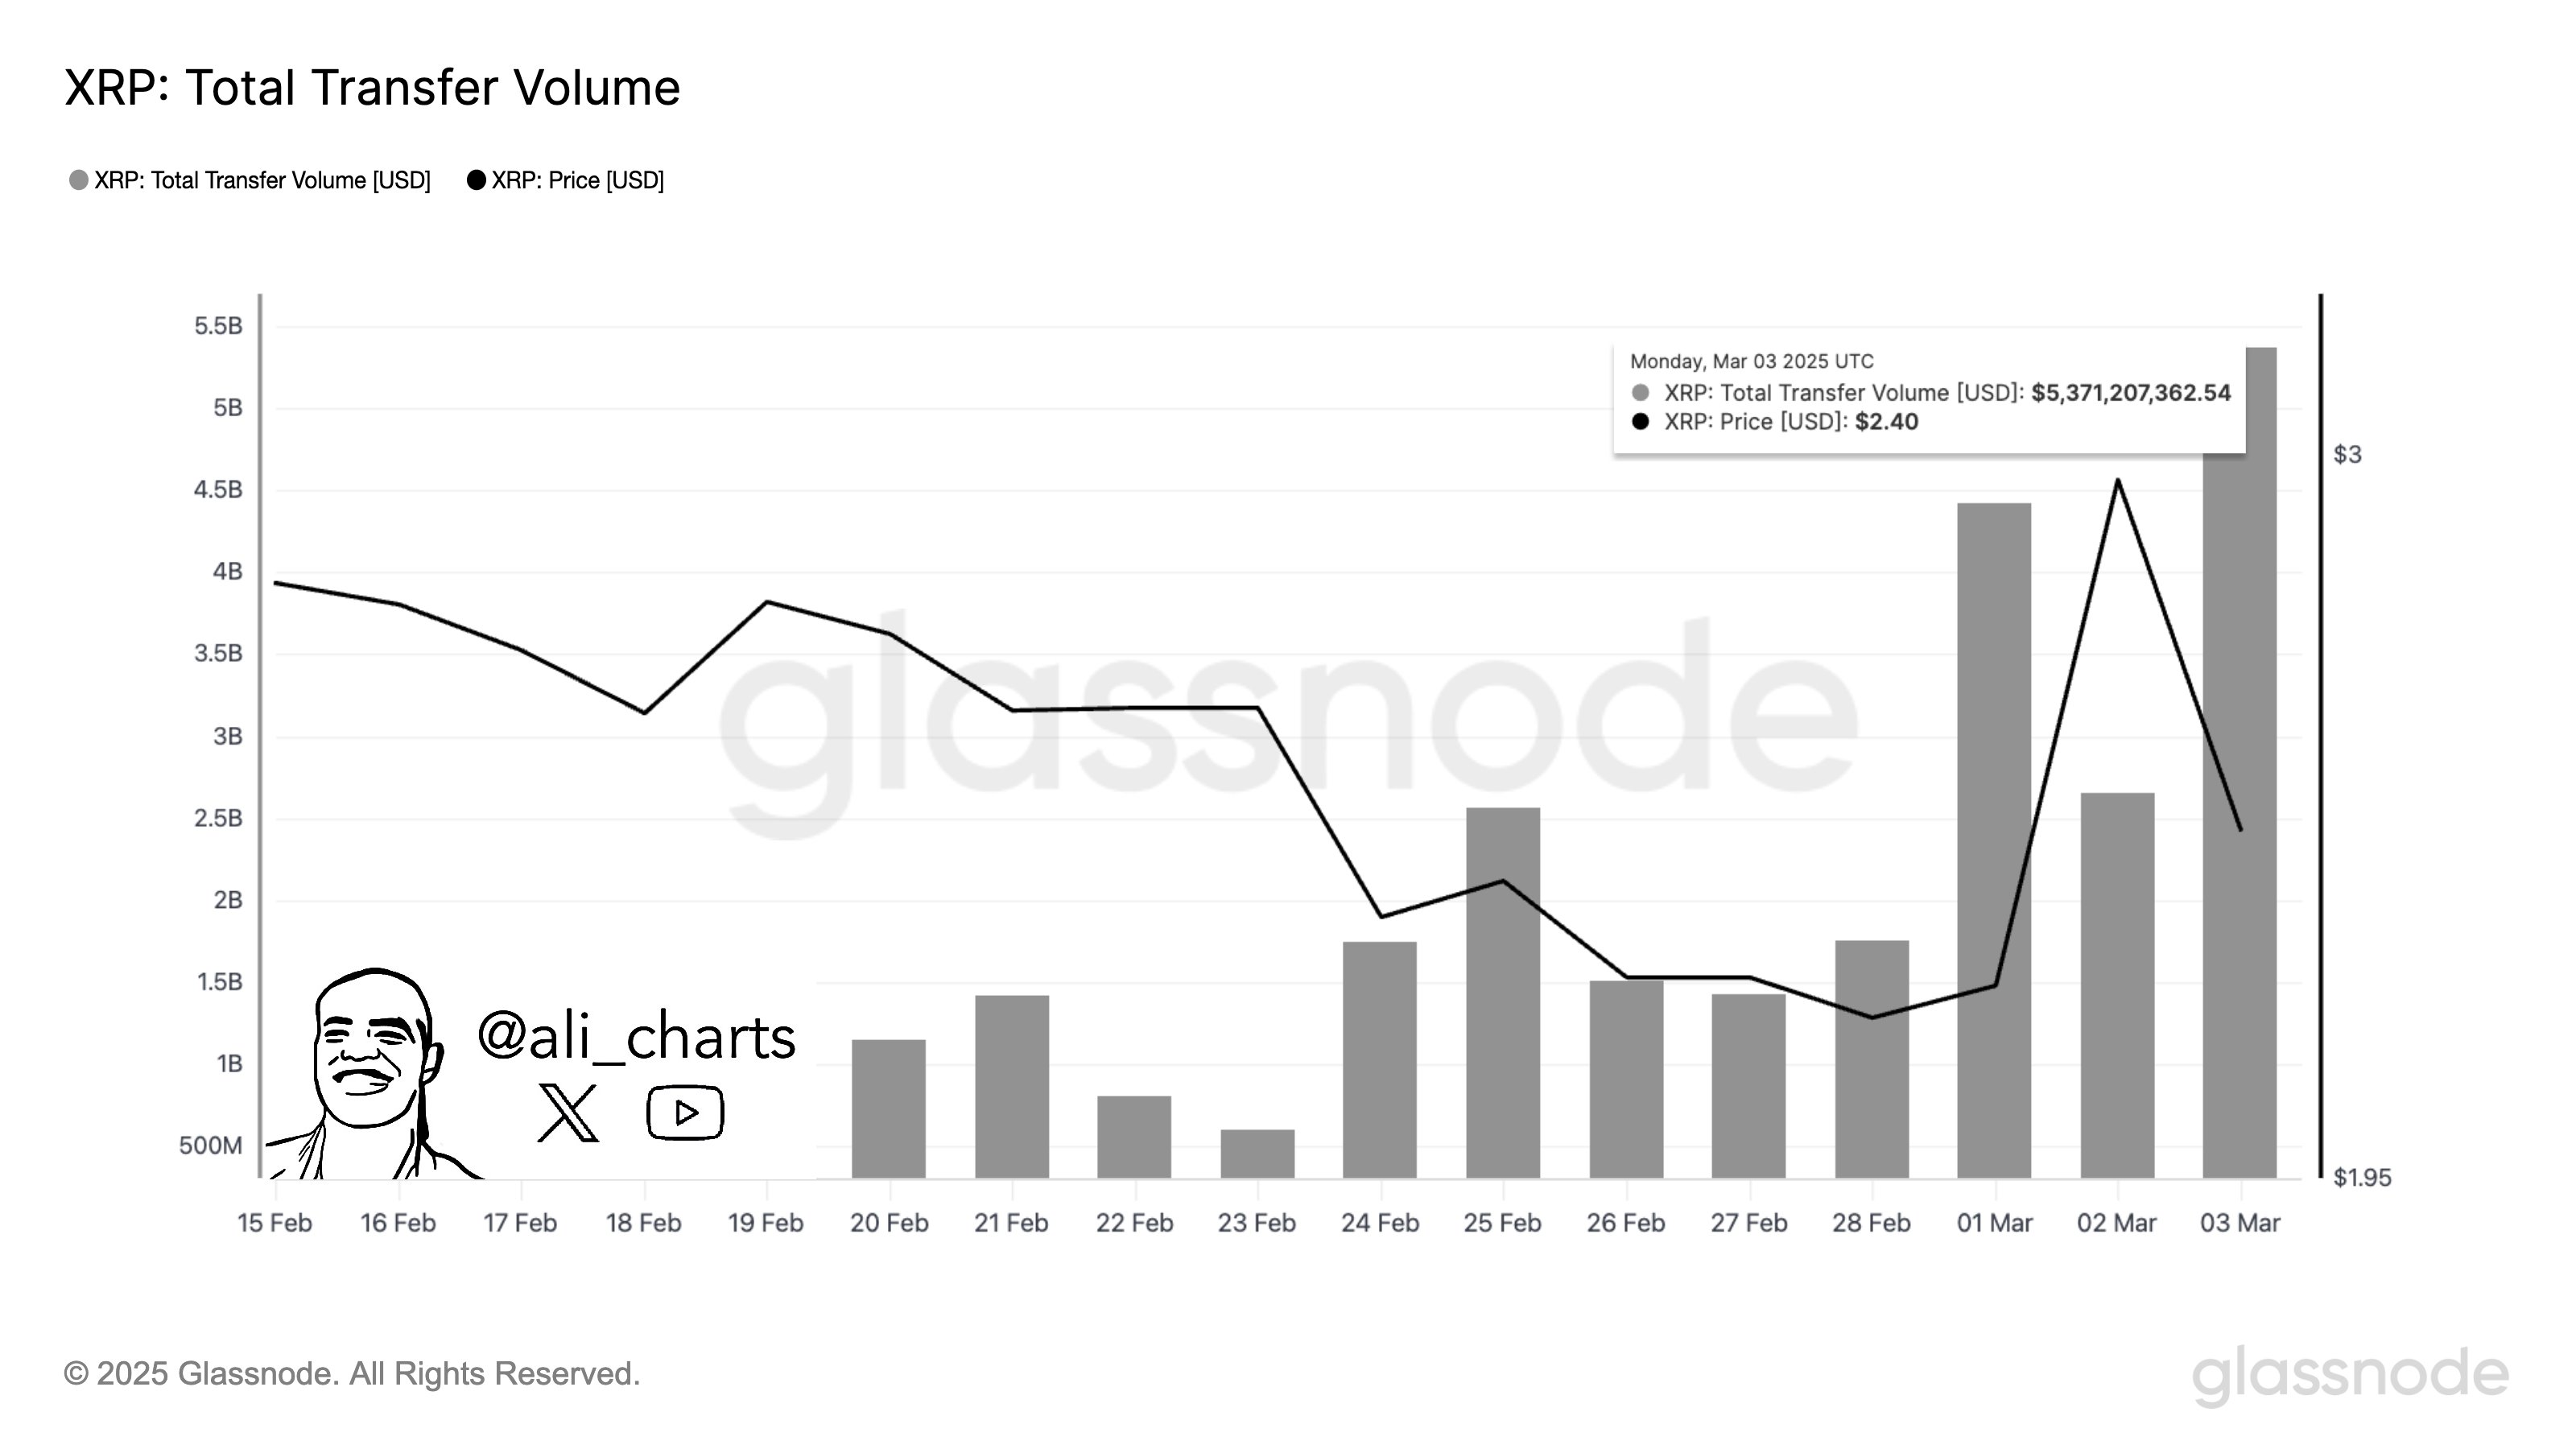
Looks like the value of the metric is quite high at the moment | Source: @ali_charts on X
The Transfer Volume measures the total amount of the asset that’s being moved around on the blockchain every day. Both this indicator and the Active Addresses deal with transaction activity, but they differ in that they put more weight on different sides of the market.
The small investors are more in number, so the Active Addresses trend tends to correlate to their behavior. On the other hand, large transactions affect the Transfer Volume to a greater degree, so the metric represents the activity of the whales.
Since both the Active Addresses and Transfer Volume have spiked, it would appear that all sides of the market are busy making moves right now, which isn’t too surprising.
XRP Price
At the time of writing, XRP is trading around $2.47, up more than 9% over the last seven days.

The price of the coin seems to have retraced its recent rally | Source: XRPUSDT on TradingView
Featured image from Dall-E, Glassnode.com, chart from TradingView.com