
Reason to trust
Strict editorial policy that focuses on accuracy, relevance, and impartiality
Created by industry experts and meticulously reviewed
The highest standards in reporting and publishing
Strict editorial policy that focuses on accuracy, relevance, and impartiality
Morbi pretium leo et nisl aliquam mollis. Quisque arcu lorem, ultricies quis pellentesque nec, ullamcorper eu odio.
Since January 31, Bitcoin (BTC) has experienced a significant correction, with the leading cryptocurrency plummeting as much as 27.52%.
Currently valued around $79,000, Bitcoin’s price is precariously balanced above a crucial support level dubbed as “the magic line,” which is set at $74,000, pivotal in determining the market’s trajectory—bullish or bearish.
A Historical Buffer Against Bear Markets
In a recent social media post on X (formerly Twitter), market expert Doctor Profit emphasized that “the magic line” placed at $74,000 in his analysis is not just a number but a key indicator of market sentiment.
Related Reading
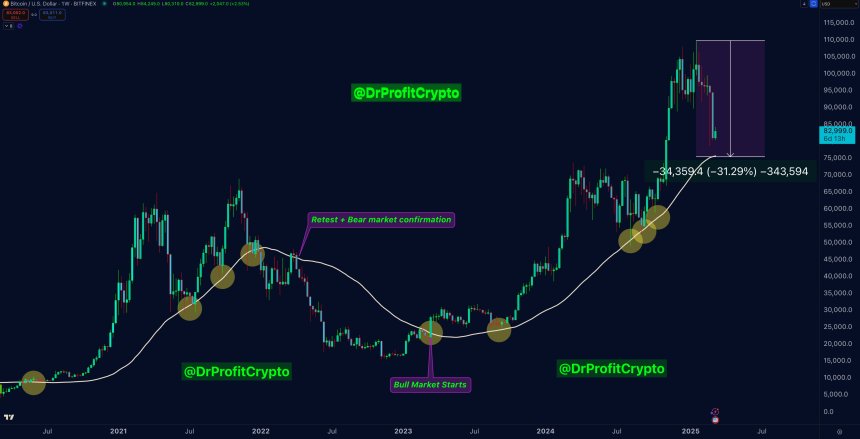
According to the expert, this line has historically acted as a buffer against bear market conditions. For instance, during the 2020 market correction, Bitcoin held above this support level until a bear market was confirmed. Doctor Profit asserts, “A massive correction, even 30-50%, does NOT mean a bear market.”
This market volatility is exacerbated by fears of a recession, driven in part by President Donald Trump’s aggressive tariff policies targeting countries like China, Canada, and Mexico.
These actions have ignited concerns over a potential trade war, further dampening investor sentiment and leading to a retreat from riskier assets, including cryptocurrencies.
However, BTC is not alone in this downtrend. Peers such as Ethereum (ETH), XRP, Solana (SOL), and Cardano (ADA), have also followed Bitcoin’s lead in this regard, experiencing 10%, 6%,5% and 6% drops respectively in the 24-hour time frame.
Optimal Bitcoin Entry Point Between $52,000 and $60,000?
In another recent post on social media platform X, Doctor Profit discussed a possible recession scenario, suggesting that the optimal entry point for investors might be between $52,000 and $60,000.
This forecast implies a troubling potential drop of another 34% from $79,000 towards the worst case scenario for BTC’s price at $52,000 if this occurs, heightening concerns among traders and investors alike.
Related Reading
Doctor Profit remains vigilant, monitoring not only Bitcoin’s movements but also the stock market’s influence on crypto prices. He has set his sights on a critical short position with a target profit level (TP1) aligning with the magic line.
“If Bitcoin bounces hard, I’ll re-enter,” the market expert stated. Doctor Profit concluded his analysis saying that “If it shows weakness, I’ll stay in cash and hunt for lower entries between $50,000 and $60,000.”

While finding at least a temporary foothold at the $79,460 mark, the largest digital asset, BTC, is down 14% in the past two weeks, reaching its lowest level since November 2024.
Featured image from DALL-E, chart from TradingView.com